Activity Name:
How Turbid is Your Pond? Using Computer Systems to Monitor the Environment
Grade Level:
Grade 9-12
Time Required:
180 minutes
Expendable Cost:
All components could be used in other projects except those with very minimal costs e.g. LEDs, LED holders and resistors, roughly $10 in non-reusable parts.
Group Size:
4
Subject area:
computer science, lab science
Summary:
Students will build a system that monitors turbidity levels in a body of water. They will learn about using a light dependent resistor (LDR) and light emitting diode (LED) together to monitor the level of light, lumens, that passes through the water. Students will use the Arduino programming language to control the processes. They will use a range of readily available electronic components to build the system.
Keywords:
Arduino, programming, light dependent resistor (LDR) , light emitting diode (LED), liquid crystal display (LCD), water pollution
Educational Standards:
NGSS
- MS-ESS3-5
- Ask questions to clarify evidence of the factors that have caused the rise in global temperatures over the past century.
- MS-ETS1-4
- Develop a model to generate data for iterative testing and modification of a proposed object, tool, or process such that an optimal design can be achieved.
Prerequisite Knowledge:
Students need to be aware of what is meant by pollution and turbidity in water. They would benefit from having some initial background in working with small electrical components. Similarly, having prior exposure to programming would be of use.
Students need not be required to program as code is supplied. However, students with prior programming experience would be able to extend and modify supplied code.
Learning Objectives:
- To be able to agree and work towards a group solution to a problem solvable with computer science tools.
- To understand how to abstract the essence of a problem and decompose it into its constituent parts
- To know how to build an engineering solution incorporating hardware and software to solve a real-world problem.
- To understand the value of testing and refining a solution to ensure it works at optimum efficiency.
Materials List:
- SparkFun RedBoard
- Breadboard
- 16 x 2 LCD module
- Potentiometer
- 5mm LED
- Light dependent resistor
- 2 x 5mm LED holder
- Set of alligator leads x 4
- Jumper wires x 20
- Resistors x 3 value 220 Ohm - 330 Ohm
- Piezo buzzer
- Battery holder and batteries (optional but required if used out of classroom)
- USB lead
- Small water tank
- Hot glue gun and glue
- Code files:
Introduction / Motivation:
We are going to investigate water turbidity and how this can be monitored over time. Using electrical components, we will build a system that uses light to measure how much material is suspended in the water. The experiment will run over a number of days so that we can collect readings to test the system. We will record how long it takes water to become turbid. As part of our experiment, we will agree the readings act as measurement of turbidity.
To test our system we will run the experiment in different locations in and out of the lab. This will provide us with knowledge of how an engineering system is affected by different environmental factors, particularly the light available in the environment.
When building the system, we will develop our knowledge of electrical components such as light sensors, LEDs, mini screens and resistors.
Starting from a simple circuit that measures light, we will develop and test our system, refining as we go. We will test the components and judge suitability for solving our environmental monitoring system. In doing this, we will learn how components work together to serve a purpose. The system we will use is the Arduino programming language. The code provided to drive the system allows you to work with variables and functions to investigate how code can be developed.
You will investigate how computer code is constructed and how it can be modified to ensure that our system provides the best possible results.
Procedure:
Background
Some familiarity with programming discipline and basic electrical components will be useful but not essential. Additionally, prior to building the water quality monitoring system, encourage your students to investigate the topic, perhaps as homework:
Students will develop an understanding that water quality can be judged by how far or deeply we can see through the body of water. From this, students should be encouraged to fine tune the idea so that they can discuss scales of visibility.
Procedure 1 - Create basic LDR test system:
- Begin by checking the components list to begin Build 1.
- Insert the legs of the LDR into the Breadboard.
- Insert a resistor into the breadboard ensuring that one leg is in the same vertical channel as one of the legs of the LDR (see Figure 1).
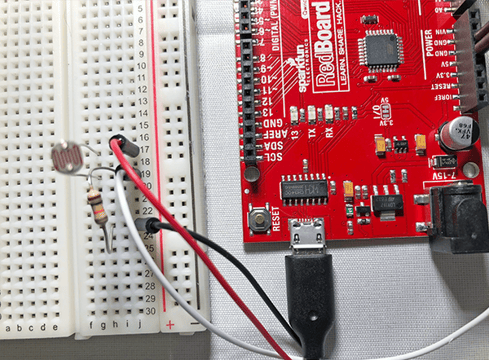 Figure 1
- The remaining leg of the resistor should be aligned with one of the jumper wires (follow convention and use black if possible) that is plugged into the ground (GND) pin of the RedBoard.
- To complete the electrical circuit plug a jumper wire, red preferable, into the 5v pin on the RedBoard and align the other end with the leg of the LDR not linked to the resistor.
- Use a 3rd wire connected to pin A5 on the RedBoard and in line with the resistor and LDR legs on the breadboard (see Figure 2).
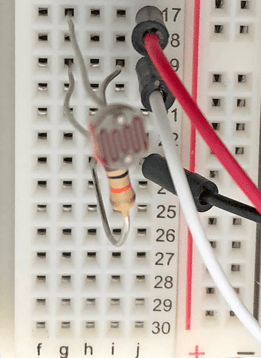 Figure 2
- With the system built, load the example code “ldrTest”.
- Connect the RedBoard to your computer.
- Ensure that the correct board is selected – “Arduino/Genuino Uno”.
- Upload your code to the RedBoard by clicking the arrow in the top left corner of the application.
- Open the Serial Monitor – if all goes well, you will see a series of numbers output to the Serial Monitor.
- Check that readings are being taken – turn off a light, cover the led with your finger.
Procedure 2 - Set up the LCD:
- You will need access to your jumper wires, LCD screen, potentiometer, resistor.
- Begin by plugging the LCD into the Breadboard.
- Unplug the live (red) and GND (black) jumper wires from the Breadboard and plug them back into the Breadboard on the power rails.
- See Fig 3 for the position of the jumper wires. These will deliver power to the range of components being used.
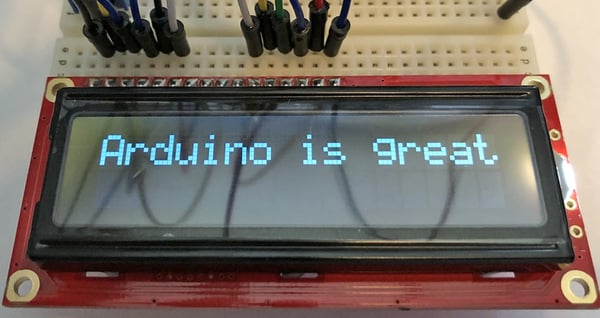
Figure 3
- Whilst you are at this end of the Breadboard, plug the potentiometer into the system. This will be used to adjust the contrast of the LCD screen.
- With the LCD and potentiometer in place, plug 12 jumper wires into the Breadboard as shown above in Fig 3.
- Counting from the left pin of the LCD, place 6 wires consecutively into the first 6 pin slots. Leave a gap of 4 pins and place the next 6 jumper wires in place. You should have the 4 middle pins without wires.
- Pin destination
- 1 = Breadboard power rail GND
- 2 = Breadboard power rail LIVE
- 3 = Middle pin of potentiometer – see figure 14
- 4 = Digital pin 12 on the RedBoard
- 5 = Breadboard power rail GND
- 6 = Digital pin 7 on the RedBoard
- 11 = Digital pin 11 on the RedBoard
- 12 = Digital pin 6 on the RedBoard
- 13 = Digital pin 13 on the RedBoard
- 14 = Digital pin 4 on the RedBoard
- 15 = Place a resistor on the Breadboard plugged into the LIVE power rail.
- 16 = Breadboard power rail GND
- Plug the jumper wire into the Breadboard to make a connection between the resistor and power rail. See Fig 4
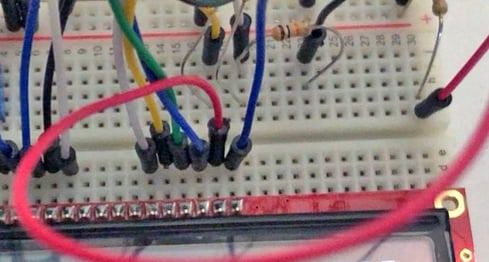 Figure 4
- Check all jumper wires!
- Connect the potentiometer to the system: take 2 jumper wires connect the right-hand leg to the LIVE breadboard power rail and the left-hand leg to the GND Breadboard power rail – Fig 5.
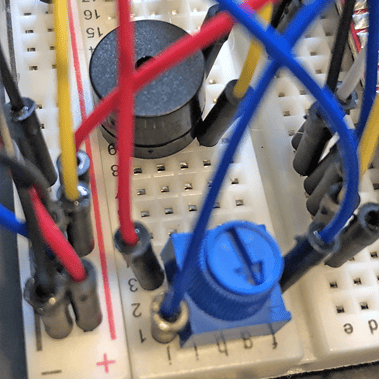 Figure 5
- Congratulations! Your system is now ready for testing of the LCD.
- Open the sketch “basicLCD”. This sketch simply sends a message to the LCD. Vary the message to suit your ideas. Experiment with the delay command. If no message is seen on the LCD, turn the potentiometer left or right until the text shows.
Procedure 3 - Create the pollution cradle
- Note: It is recommended that you drill the hole without students or under heavy supervision.
- Take the outside case of the water tank, place a strip of painters tape across the plastic case – this is to prevent the plastic cracking when you drill.
- Mark the entry point on the tape – double check that the left and right marks are on the same vertical and horizontal position. See Fig 6 and 7
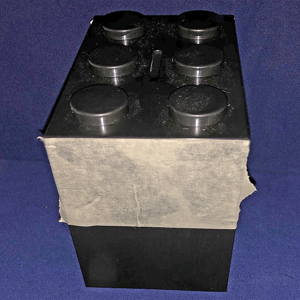
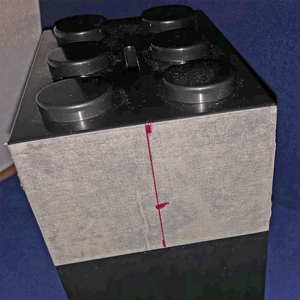
Figures 6 & 7
- Carefully drill through the plastic case, a slow speed will work best. Use a drill bit large enough to take the LED holders.
- Remove any burs from the plastic.
- With an LED and one of the LED holders, place the LED into the holder, reverse the plastic plug and push into the drill hole. Check that the LED holder is flush with the internal side of the case. Using a dab of hot glue, glue the LED holder in place. See Figs 8 and 9
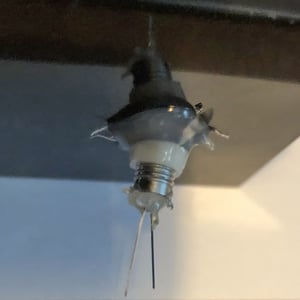
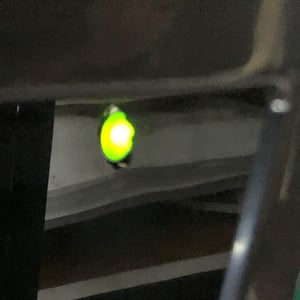
Figures 8 & 9
- Remove the LDR from the Breadboard and repeat the LED process on the other side of the plastic case.
- Attach an alligator lead to each of the LDR legs. Clip one of the alligator leads to the original LDR jumper wire linked to the resistor.
- Unplug the LIVE lead of the LDR from the Breadboard power rail and clip it to the remaining alligator lead. The two LDR leads connected to the alligator cables are in the center of Fig 10 row 17 and 18.
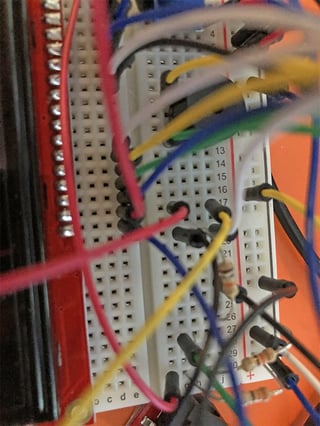 Figure 10
- Fix a resistor to the Breadboard with one leg in the GND power rail and the other on the main body of the Breadboard. Plug a jumper wire into the Breadboard vertically in line with the resistor. Attach an alligator lead to the jumper wire and the other end to the short (cathode) leg of the LED.
- Plug a jumper wire into the LIVE power rail of the Breadboard and attach an alligator lead between this and the remaining LED leg.
- Check all connections. When satisfied that all is working, upload sketch “LCDldrReadV1”. Ensure the RedBoard is attached to the computer via the USB. Your LCD should be telling you what the light level is. If all works, upload sketch “LCDldrReadV2” and test it out. Modify the variables to fit.
- Check that everything is working.
- Test the system with different types of colored water – take care not to splash water over the electronics!
- When you are happy that the system is working, attach a piezo buzzer to the breadboard.
- Using 2 jumper wires, connect each wire to the breadboard pins of the buzzer and one wire to the GND pin on the RedBoard (use the digital pin side GND pin). The other wire should be connected to pin 13 on the RedBoard.
- Upload sketch “LCDldrReadV3”. Run the code with different light and colored water levels. When the light level drops below the designated safety level, the buzzer should make a sound.
- Adapt the variables to fit, e.g. adjust the length and tone of the buzzer.
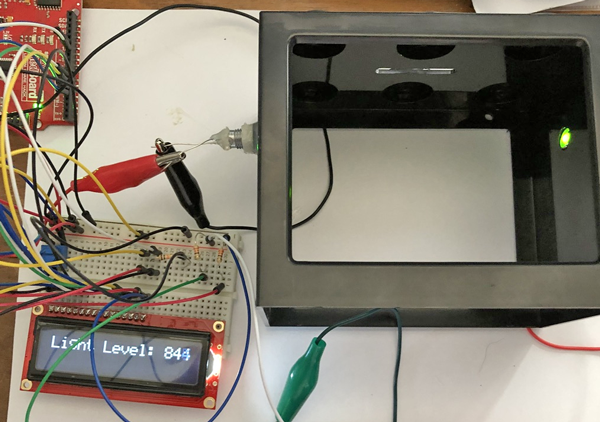 Ready for testing!
Troubleshooting Tips:
- Check the wiring as you go. If the system does not work at key points in Procedure 1 – Procedure 3, check the wiring connections and resistor placement.
- Are the GRD and LIVE power rails on the Breadboard connected?
- Is the resistor to the LED connected in the circuit to the anode (short leg) of the LED? Has the LED been blown?
Going further:
With the system components it would be possible to go even further:
Recording data in a classroom environment
- Start with a small amount of green water i.e. water with algae in it. Perhaps ask students to bring a small sample into class. Use this as ‘seed’ to start the water cycle.
- If using Windows, consider using the program RealTerm to capture the serial monitor data to a file. This will allow your students to investigate the rate at which water becomes polluted. They can leave the system running over a period of time. When the system raises an alarm, either through the siren, see Procedure 3, or when it reaches a verifiable level via the LCD, The data can then be manipulate in a spreadsheet application to produce a report with graphs charting the water activity.
- Check out the SparkFun guide on the use of RealTerm
Recording data in the field
- If your school has access to a pond (be careful around water), remove the LED from the experiment and move the system outdoors. Adding a microSD card to the system will allow you to capture data away from the system (This can also be used in place of RealTerm).
- A microSD reader is relatively easy to install. See this link for an excellent guide. MicroSD readers can be supplied by SparkFun
- Remove the LED from the system and wire a new Ldr with longer jumper wires. Add the microSD shield. Place the system in a waterproof box e.g. a lunch container, sheave the LDR and wires in a transparent plastic bag, place a small weight in the bag - enough to allow the LDR and wiring to remain submerged. Check that the LDR and wires are protected from the water. Add a battery pack, switch on and leave the system to record. Come back at some stage, remove the SD card and download the data to a suitable application for analysis and reporting.
Navigate by LDR
- Use several systems to guide a person around a room. Strip the system back so that the LDR and piezo buzzer are attached. Code the RedBoard so that the piezo outputs a note if the light level goes below an agreed threshold e.g. 750. Being careful that there are no trip hazards, students should take it in turn to move around a space with their eyes closed, changing direction when a tone is heard to signify that they are close to an object. Who can navigate the space without bumping into object?
- After this experiment, get the students to consider how simple systems comprised of LDRs and buzzers could be used by people with sight accessibility need.


