Activity Name:
Weather Snapshot with the SparkFun micro:climate Kit
Grade Level:
It is targeted for grade 7, but could work for grades 6 to 8.
Time Required:
110 minutes
Expendable Cost:
none
Group Size:
Whole class
Subject area:
earth & space
Summary:
Using the SparkFun micro:climate Kit, students gather data about weather by using traditional weather observation tools such as an anemometer and wind vane and by using innovative technologies such as the SparkFun weather:bit, a SparkFun extension for the micro:bit, that students can easily program to collect real-time data about factors that affect weather such as temperature, pressure, humidity, precipitation, and wind.
Keywords:
micro:bit, weather, earth science, climate, climate change, STEM, environmental science, inquiry
Educational Standards:
ISTE
- Knowledge Constructor
- 3c - Students curate information from digital resources using a variety of tools and methods to create collections of artifacts that demonstrate meaningful connections or conclusions.
- 3d - Students build knowledge by actively exploring real-world issues and problems, developing ideas and theories and pursuing answers and solutions.
NGSS
- MS-ESS2-5 Earth’s Systems
- Students who demonstrate an understanding can: Collect data to provide evidence for how the motions and complex interactions of air masses result in changes in weather conditions.
Prerequisite Knowledge:
Before completing this assignment students should be familiar with the capabilities of micro:bit and feel comfortable creating basic programs in the MakeCode environment. Try visiting the micro:bit MakeCode page and completing a few of the tutorials ahead of time.
Learning Objectives:
- Students will learn how to use technology and professional weather observation tools to explore Earth Science.
- Students will be able to demonstrate how air mass affects weather conditions.
Materials List:
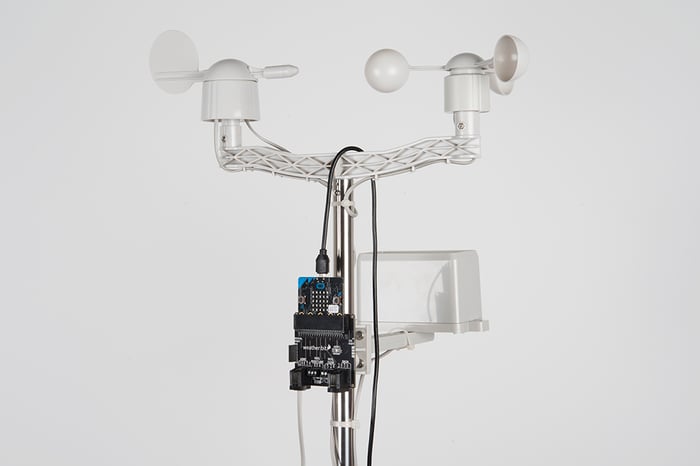
- SparkFun micro:climate kit
Introduction / Motivation:
Today, we're going to explore weather monitoring tools. How many of you have ever watched a weather report on TV or looked one up online? Where do they get this information? Meteorologists, or people who study the weather, are able to create weather reports by tracking temperature, air pressure, wind speed and wind direction throughout the troposphere, or lowest level of the atmosphere. While we don't have access to all the tools they have, we can still create a station that will tell us about the weather near us. Today, we're going to analyze the tools available to us and discuss how they are similar to ones that meteorologists may use. Then, we will install our weather station and use the data it collects to become better informed about our own weather.
Procedure:
Before the Activity
- Assemble the weather meters and familiarize yourself with the SparkFun micro:climate Kit. Here is an easy to follow guide that shows you how to assemble the weather meters.
- Note: For this project we will only use the weather meters, we will not use the soil sensors or the OpenLog component.
- Check out the SparkFun micro:climate Kit experiment guide and read the first two sections that introduce the SparkFun micro:climate Kit and the weather:bit. You don’t need to work through all of the experiments before beginning this project, this project will provide you with the code that you need to get started. However, if you want more information about all of the awesome capabilities of the micro:climate kit or if you’re just super excited about this kit, completing the experiments might be a great idea.
With the Students
Day 1
- Have students investigate the instruments included in the SparkFun micro:climate Kit and identify their purposes.
- What are they?
- What do they measure?
- Where is that measurement used in real life?
- Encourage investigation into STEM careers by asking students to research the instruments that their local meteorologists use and to identify any similarities and differences with the tools they are using in the classroom.
- What other professions work with environmental data?
- What jobs require that information to do their jobs safely?
- Share the example code (this is the same code found in the SparkFun micro:climate Kit experiment guide) below with students as a starting point. Encourage them to go further by creating their own programs in MakeCode to interact with the weather:bit.
- Reading temperature, humidity and pressure
- Reading wind direction and speed
- Reading the rain gauge
Place the Weather Meter Outside
Note: This can be done before the lesson, but it is always more exciting if students are given the chance to experiment with it in the classroom before it is placed outside.
- Find a good place for your weather meters. Your weather meters should be placed outside somewhere that’s easy for you and your students to access. The weather meters can remain outside without any issues but make sure you don’t leave the weather:bit and micro:bit outside, exposed to the elements. If you want to leave these outside, consider making a waterproof enclosure for your weather:bit and micro:bit or use this pre-made enclosure from SparkFun.
Tip: If you use the SparkFun enclosure, you’ll need to drill a hole in it to allow for airflow and exiting cables.
Note: The rain sensor measures the amount of rain that has fallen starting from when you start the program on your micro:bit. If you want to capture precipitation data while it’s raining, make sure the micro:bit and weather:bit are enclosed in a waterproof enclosure.
Tip: Not sure where to put your weather meters? The SparkFun micro:climate Kit includes hardware that makes it easy to mount the weather meters to a fence post.
Day 2
Using Data From the Weather Meter
Once you've collected a day or more's worth of data from the micro:climate Kit, it is time to talk about the data in class.
Here’s where that adaptability mentioned at the beginning of this project and your expertise and classroom requirements come into play. Each educator teaches content in their own way, that’s why I’ve created an editable worksheet to accompany this project.
(Picture: “Worksheetoverview1”)
The questions here are meant to facilitate features of student performance for this standard such as making observations and recording data “either firsthand and/or from professional weather monitoring services.”
The worksheet is intentionally simple so that you can easily change or rearrange the elements to fit your class. If you’re an educator who uses the Google Drive suite of tools, you can open this document as a google doc here. Save it as a copy to your Google Drive to begin to make changes. If you have awesome PDF editing software, or you don’t want to make any changes and you just want to print out the worksheet, you can download the PDF version of this document here.
Tip: If you’re an educator who uses Google Docs with your students, you can delete the lines that are meant for writing on and have your students type their responses instead.
Here are some examples of how you might edit the worksheets to fit your students:
- Maybe you’re teaching 7th and 8th graders and you feel that the first two questions about how the day looks and feels are more appropriate for younger students. Simply highlight and delete the content you want to get rid of. (Picture: “delete first page”)
- Cover more of the standards concepts, such as the relationship between air mass movement and changes in weather, by changing the “comments” section to your own prompt. For example, you can supplement students’ data collection from the weather:bit with a map from a local weather station that visualizes air mass movement and ask students to reflect on how the data from that map might relate to the data they collected.(Picture: “change comment text”)
Tip: Add more lines for writing on to encourage longer student responses by right clicking (ctrl + click on mac) and selecting “add row below”.
- Collect more than one day’s worth of data in the log selection by adding more columns. (Picture: “week long data log”) Download a PDF of this version here.
Going Further:
- Strengthen students’ connection to computer science by incorporating radio functionality into this project. Challenge students to program two micro:bits that communicate with each other using the radio blocks in MakeCode. Prompt them to program the micro:bit attached to the weather:bit to send data that one or more additional micro:bits receive. You could have one receiver micro:bit that receives all the data, or there could be a micro:bit for each variable that students are investigating.
- Investigate the parts of the SparkFun micro:climate Kit that were not used during this project such as the soil sensors and the OpenLog for automatically logging the weather data.
- Challenge students to create an interactive and real-time data visualization of the weather data by using the radio functionality of the micro:bit and outputs like lights and motors. For example, have the micro:bit, connected to the weather:bit, send data about the wind speed to another micro:bit with a strip of programmable LED lights, such as neopixels, attached. Program the LED lights to change colors or to get brighter when the wind speed changes.